If you own a Charlotte rental, you may have seen the headline: building permits in Mecklenburg County have collapsed. It sounds like good news for your next vacancy. Fewer new houses, less competition, easier leasing.
We went into the records to check what the numbers mean.
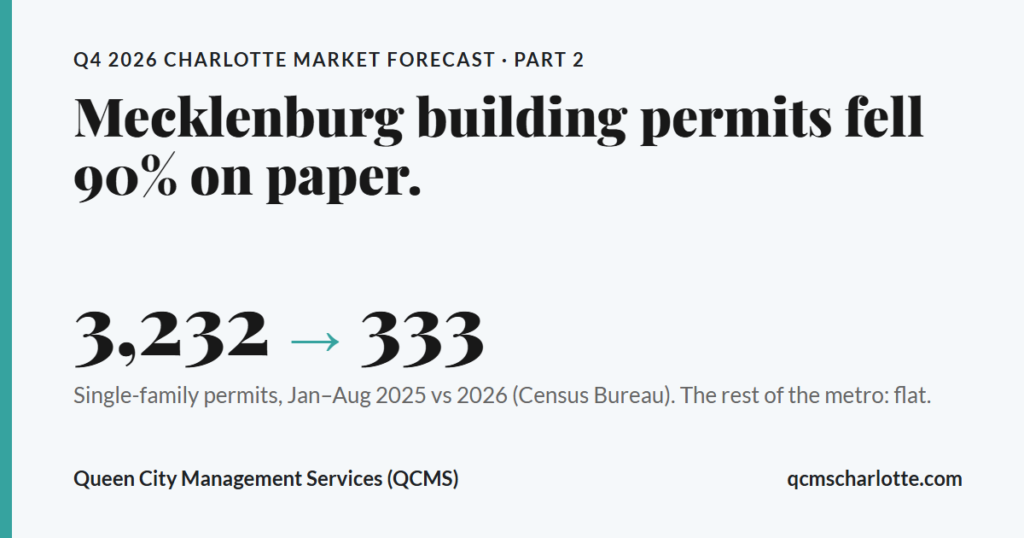
The finding in one sentence: Mecklenburg’s published single-family permit counts fell about 90% in January through August 2026 against the same months of 2025, but the drop begins in May 2025, the county says its public monthly reports cover only its older permit systems, and the rest of the Charlotte metro shows steady house permits and more apartment permits. Public data cannot tell us whether Charlotte actually stopped building.
Part 1 of this series showed Charlotte single-family rentals taking about 11% longer to lease in 2026 than in 2025. It found one supply pipeline clearly shrinking: build-to-rent homes under construction in Charlotte, down 38% year over year (National Apartment Association). It then said other pipelines looked to be contracting too, and promised to test that against Charlotte’s own permit and rezoning records, “including if it contradicts what’s above.” This is that test. On permits, the local data does not confirm a wider contraction.
What do Mecklenburg’s building permit numbers show?
Census Bureau permit data, January through August, 2025 against 2026:
| Units permitted, January to August | 2025 | 2026 |
|---|---|---|
| Mecklenburg, single-family homes | 3,232 | 333 |
| Rest of the Charlotte metro, single-family homes | 7,645 | 7,665 |
| Mecklenburg, units in buildings of 5+ | 2,640 | 2,826 |
| Rest of the metro, units in buildings of 5+ | 1,245 | 1,990 |
Source: U.S. Census Bureau Building Permits Survey, county files, year-to-date through August. “Rest of the metro” is the other nine counties in the Charlotte-Concord-Gastonia area (Anson, Cabarrus, Gaston, Lincoln, Rowan, Union, Chester, Lancaster, York). QCMS sums.
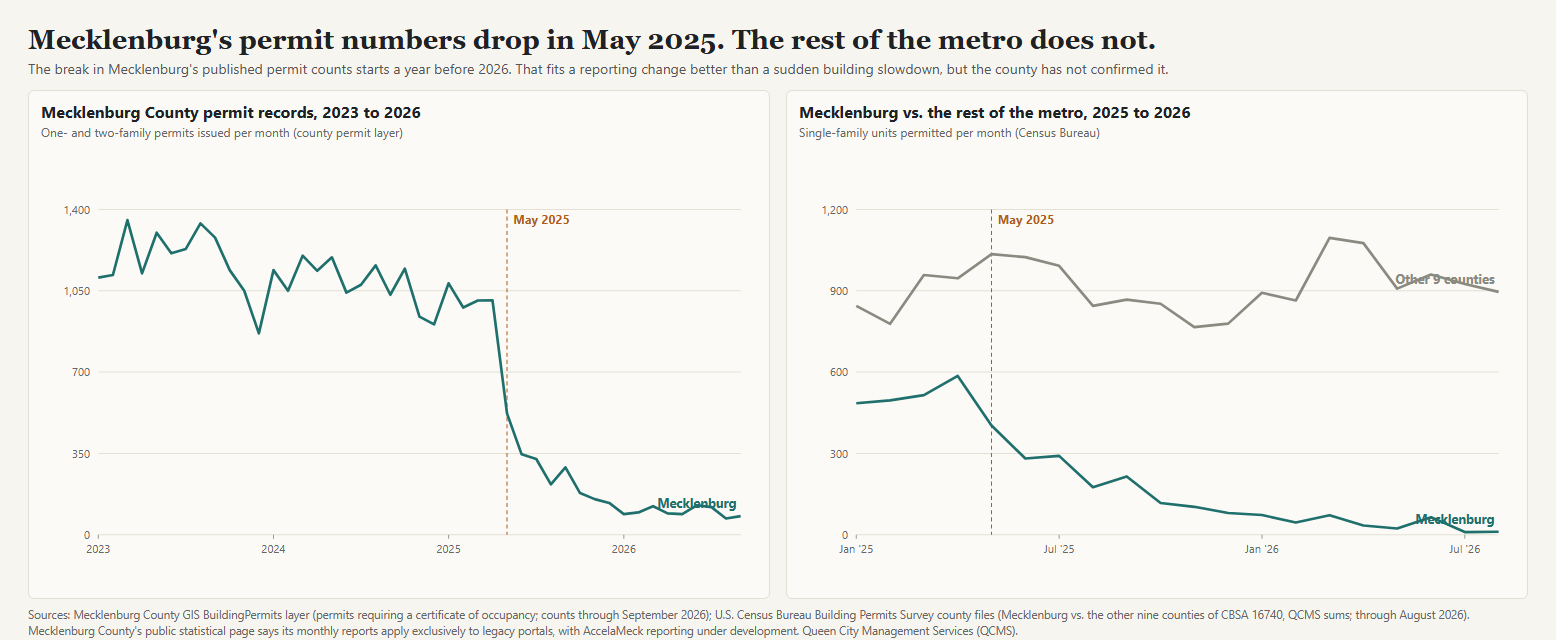
Look at the timing. Mecklenburg’s own permit records run about 900 to 1,350 one- and two-family permits a month from January 2023 through April 2025. In May 2025 the count drops to 522. By June it is 346. Every month of 2026 is under 130. The Census series for Mecklenburg breaks at the same point.
A drop that steep in one month looks more like a change in how permits are counted than a change in how many are being pulled. That is our judgment, not the county’s finding.
What could explain the drop?
The explanation we find most plausible is a reporting gap, and we cannot prove it.
Mecklenburg County Code Enforcement now issues permits through a new portal, AccelaMeck. The county’s public statistical data page says its monthly reports “apply exclusively to our legacy portals” and that updated reporting “is under development for AccelaMeck.” Census numbers come from what local governments report, so a gap in county reporting would show up in the national files too. That last step is our inference.
Three other things point the same way. The rest of the metro is flat for houses. Apartment permits are still being counted, in Mecklenburg and elsewhere. And the drop starts in 2025, well before any 2026 slowdown could explain it.
The county has not said how much of the decline the reporting gap explains.
Is anyone still building around Charlotte?
The rest of the metro says yes. Permits for units in buildings of five or more are up there, 1,245 to 1,990 through August. York County alone went from 190 to 782. Mecklenburg’s count, which still appears in the data, is slightly higher at 2,826 against 2,640.
Permits are not completions, and a permitted building is not yet a leasing building. Still, permits are the earliest local sign of what will compete for renters later, and this one points up. We have not measured how many of these units reach lease-up or when, so treat any timing as a hypothesis.
What we can and cannot say
We can say that Mecklenburg’s published house permit count fell about 90%, that the rest of the metro’s did not, and that the county documents a limit in its public reporting.
We cannot say whether Mecklenburg builds fewer houses than it did, how much of the decline is real, or what any of it does to 2027 rents.
What we’re seeing on the ground at QCMS
As owner and operator of Queen City Management Services (QCMS), we are seeing longer lease times across our own rentals. That is our experience managing Charlotte rentals since 2013, not a measured statistic. It shows up across the board: in UNCC Rooms, our by-the-room student housing for the UNC Charlotte market, and in our single-family homes across Mecklenburg County.
Part of that is timing. In our experience, rental applications slow every year from October through December, with the holidays and year-end closeouts. A slow fall is normal for us, so we do not treat one season as a trend. What the seasonal pattern cannot explain is a decline from the same month a year earlier.
Canopy MLS shows that kind of year-over-year drop on the sales side. In September, Mecklenburg County closed sales fell 15.6% from September 2025, to 1,129 homes, and pending sales fell 12.4%, to 1,077 contracts (Canopy Realtor Association, October 23, 2026). Canopy’s president attributed the slowdown to seasonal patterns plus affordability pressure, and said sales and contracts through nine months remain close to last year’s levels. We have not tested how sales and leasing affect each other.
Four other signals Charlotte rental owners should watch: rezoning, the Fed, the ballot and September’s rental numbers.
Rezoning requests are down and concentrating
We found 129 rezoning petitions filed in 2025 and 60 so far in 2026, through October 31, in the City of Charlotte’s posted records. The city’s petition numbering ran to 142 in 2025 and has reached 71 in 2026. A numbering sequence is not a count, so we lead with the petitions we could document. Ten months into 2026, the pace is well below last year, an estimate and not a full-year result.
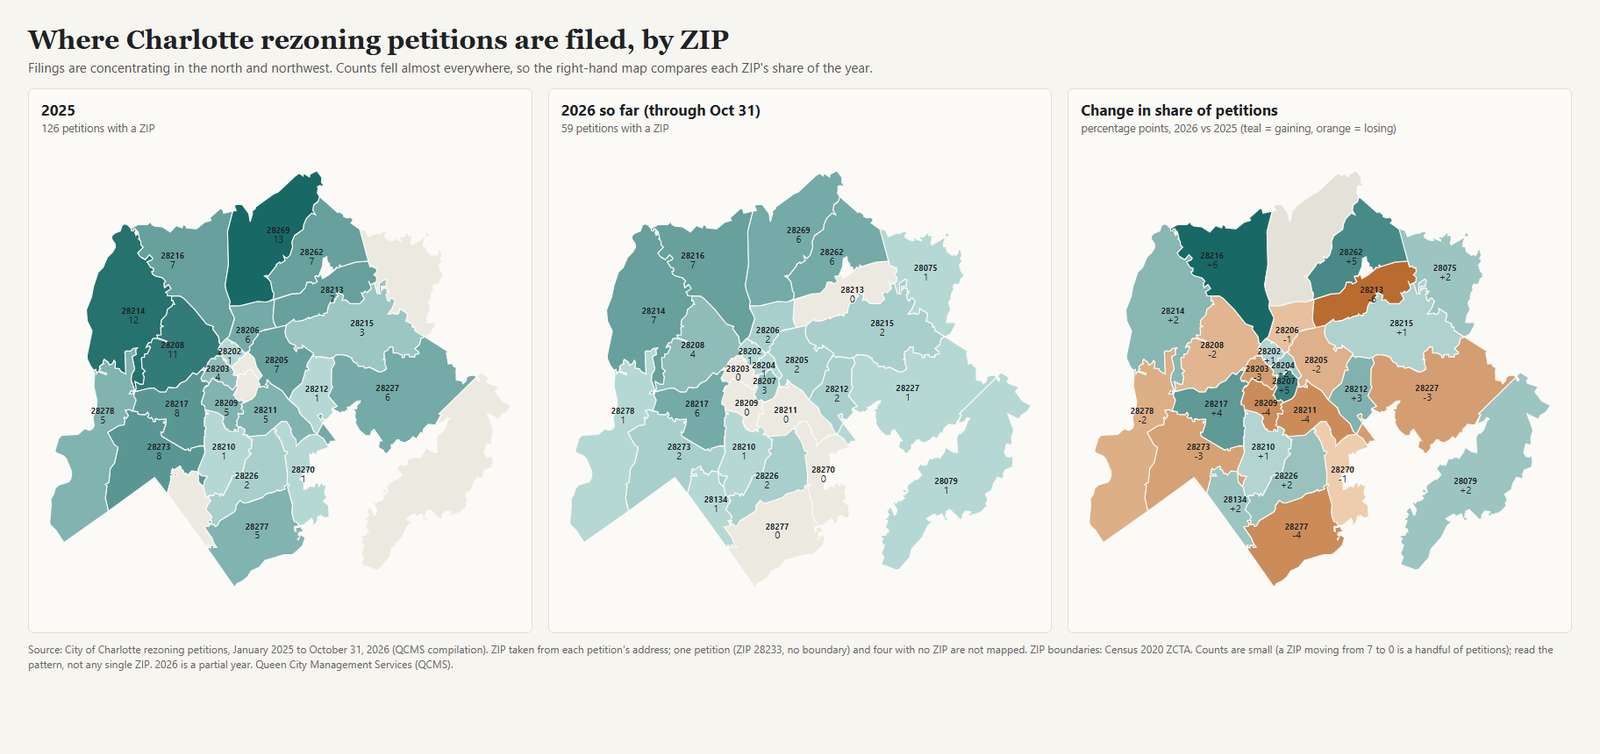
The maps show where petitions are filed. Because 2026 has fewer petitions overall, the right-hand map compares each ZIP’s share of the year, not its raw count. A ZIP can gain share while filing the same number of petitions.
In 2025 the five busiest ZIP codes held 41% of petitions. In 2026 they hold 54%. The counts behind the map:
| ZIP | Area (QCMS label) | 2025 | 2026 | Share change (pts) |
|---|---|---|---|---|
| 28269 | North (Mallard Creek) | 13 | 6 | 0 |
| 28214 | Northwest | 12 | 7 | +2 |
| 28208 | West side | 11 | 4 | -2 |
| 28217 | Southwest (airport) | 8 | 6 | +4 |
| 28216 | Northwest (Northlake) | 7 | 7 | +6 |
| 28262 | University City | 7 | 6 | +5 |
| 28273 | South (Steele Creek) | 8 | 2 | -3 |
| 28205 | East (Plaza Midwood, NoDa) | 7 | 2 | -2 |
| 28227 | East (Hickory Grove) | 6 | 1 | -3 |
| 28213 | Northeast | 7 | 0 | -6 |
| 28277 | South (Ballantyne) | 5 | 0 | -4 |
| 28209 | South (SouthPark) | 5 | 0 | -4 |
Source: City of Charlotte rezoning petitions, January 2025 to October 31, 2026, compiled by QCMS; ZIP from each petition’s address. These counts cover the 126 petitions in 2025 and 59 in 2026 that have a ZIP; four petitions have no ZIP, and one (ZIP 28233) has no map boundary. Counts per ZIP are small, so read the pattern, not any single ZIP.
We do not know why filings fell. These are untested hypotheses: some petitioners may be waiting for the city’s November 3 election, which includes the mayor and at-large council seats; 2025 may have carried a wave of requests after the city’s 2023 zoning code took effect; and borrowing costs may matter, though we would expect that effect to be smaller at the rezoning stage. If filings climb in November and December, that would be consistent with the first idea, not proof of it.
The Fed raised rates in September and held in October
The Federal Reserve raised its target range by a quarter point to 3.75% to 4.00% on September 16, on a 12 to 0 vote, and held it there on October 28. Two members voted for another quarter-point increase. The October statement says inflation “remains elevated.” (Federal Reserve statements, September 16 and October 28.)
Mortgage rates followed. Freddie Mac’s 30-year fixed averaged 7.24% on October 29, up from the 7.03% Part 1 cited for September 24 and from 6.17% a year ago. Part 1 said rates could fall and turn renters into buyers. They have not. Our read is that a household that would have bought at 6% is more likely to keep renting at 7.2%, and in this market that often means a house. We have not measured that.
What is on the November 3 ballot
Election Day is November 3. We are not taking a position on any of it. For owners, two items matter. Charlotte voters decide three city bonds totaling $425 million, including $125 million for affordable housing (City of Charlotte, WCNC). North Carolina voters decide an amendment directing the legislature to limit increases in local property-tax levies; the amendment sets no limit itself, so the details would come in later legislation (N.C. General Assembly, League of Women Voters of North Carolina).
September rental numbers
Canopy’s September report, published October 5:
- Mecklenburg active rentals: 1,563 to 1,338, down 14.4%.
- Mecklenburg leases in the 12 months ending September: 6,396 to 6,276, down 1.9%.
- Mecklenburg average lease price, same 12 months: $2,193 to $2,213, up 0.9%.
- Regional leases closed in September alone: 889 to 738, down 17.0%.
Fewer rentals are on the market and fewer are closing, with rents steady. We have not re-run days-to-lease for September. October’s Canopy report is due in early November, and we will fold both into the December installment.
What should a Charlotte rental owner do with this?
Do not budget for a quick lease because “building has stopped.” We cannot show that it has. Budget for the vacancy time Part 1 measured: the average of monthly median days-to-lease for Mecklenburg houses was 27.1 in 2026 against 24.4 in 2025.
If you are deciding whether to wait, cut the price or rent a house that is not selling, our guide to that decision walks through the numbers, and the Rent vs. Sell Calculator puts both paths side by side. If you would rather hand the vacancy math to a team, here is how QCMS manages Charlotte rentals.
Watch four things: whether the county confirms the reporting gap and what corrected numbers show; whether rezoning filings pick up after the election; Canopy’s October rental report; and January 7, 2027, when the federal ROAD to Housing Act becomes enforceable. Part 1 covers what it does and what it exempts; our piece on Wall Street and Charlotte single-family homes covers the institutional-investor side.
We will update these numbers in the December installment. If we are wrong on any of this, we will say so there. More market analysis lives in QCMS Insights.
Frequently asked questions
Did Charlotte building permits really fall 90% in 2026?
Mecklenburg County’s published single-family permit count fell about 90% in January through August 2026 against the same months of 2025: 3,232 against 333. The county’s public statistical page says its monthly reports apply exclusively to its legacy portals and that updated reporting is under development for AccelaMeck. QCMS sees a possible reporting discontinuity, but the county has not confirmed how much of the decline it explains.
Is the rest of the Charlotte area still building?
Single-family permits in the other nine counties of the metro were flat, 7,645 against 7,665 for January through August. Permits for units in buildings of five or more rose from 1,245 to 1,990.
Are Charlotte rezoning requests down?
Yes, on the petitions we could document: 129 in 2025 and 60 so far in 2026. The cause is not established.
Did the Fed cut interest rates?
No. It raised its target range to 3.75% to 4.00% on September 16 and held it on October 28. Freddie Mac’s 30-year mortgage averaged 7.24% on October 29.
Does this mean Charlotte rents will rise in 2027?
We do not know. Nothing here shows supply drying up, and rates have not eased.
Methodology and sources
- Permits: U.S. Census Bureau Building Permits Survey, county files, year-to-date through August 2025 and 2026; Mecklenburg County GIS BuildingPermits layer (covers permits that require a certificate of occupancy, so it is not every permit); Mecklenburg County Code Enforcement Statistical Data page, read November 1, 2026. Metro figures are QCMS sums of the ten counties of CBSA 16740. Units counted: single-family = 1-unit buildings; multifamily = units in buildings of 5 or more.
- Rezonings: City of Charlotte rezoning petition pages, January 2025 through October 31, 2026, compiled by QCMS; ZIP from each petition’s address; ZIP shapes from Census 2020 ZCTA.
- Rates: Federal Reserve FOMC statements of September 16 and October 28, 2026; Freddie Mac Primary Mortgage Market Survey, October 29, 2026.
- Rentals: Canopy Realtor Association, Charlotte Region Rental Report, September 2026 (current as of October 5, 2026). Part 1 days-to-lease: QCMS custom Canopy MLS Stats analysis, Mecklenburg single-family rentals, January 2025 through August 2026.
- Home sales: Canopy Realtor Association, Charlotte Housing Activity Slows in September, October 23, 2026 (Canopy MLS existing-home sales of single-family homes, condos and townhomes; Mecklenburg County closed and pending sales, September 2026 against September 2025).
- Ballot: City of Charlotte and WCNC on the Charlotte bonds; N.C. General Assembly (H1089) and League of Women Voters of North Carolina on the state amendment.
This is Part 2 of Queen City Management Services’ Q4 2026 Charlotte Market Forecast series. Market statistics change over time and should not be interpreted as a guarantee of future investment performance.