
The mortgage payment is due again and the house is still on the market. It has been a while and now you need to strategize your next move – should we keep cutting the sale price or just rent it out for now?
In October 2026, the Charlotte market is slower than it was two years ago, but it hasn’t broken. For a Charlotte homeowner in this position, renting can be the right answer, but only when a realistic rent covers the real cost of holding the house and the owner can carry a vacancy and repairs. Let’s take a look at the situation of continuing to sell versus renting in this type of market. The decision starts with putting all three options side by side.
The Charlotte Ledger covered our research on Mecklenburg County rental listings on September 30. As boots on the ground and actual operators in Charlotte property management, we pulled the numbers ourselves to see what happens after an owner rents. This article looks at the step before it, when the house hasn’t sold and renting starts to look like the way out.
Why is my Charlotte house taking so long to sell?
The market didn’t suddenly stop in fall 2026. The bigger slowdown came earlier. According to Canopy MLS, homes in Mecklenburg County were already taking 33% to 37% longer to sell during parts of 2025. By the third quarter of 2026, days on market were 43, just 0.6% higher than a year earlier. Selling got slower and has stayed slow.
Mecklenburg County also had 3.9 months of supply in the third quarter, up 21.8%, with 4,559 homes for sale, up 11.4%.
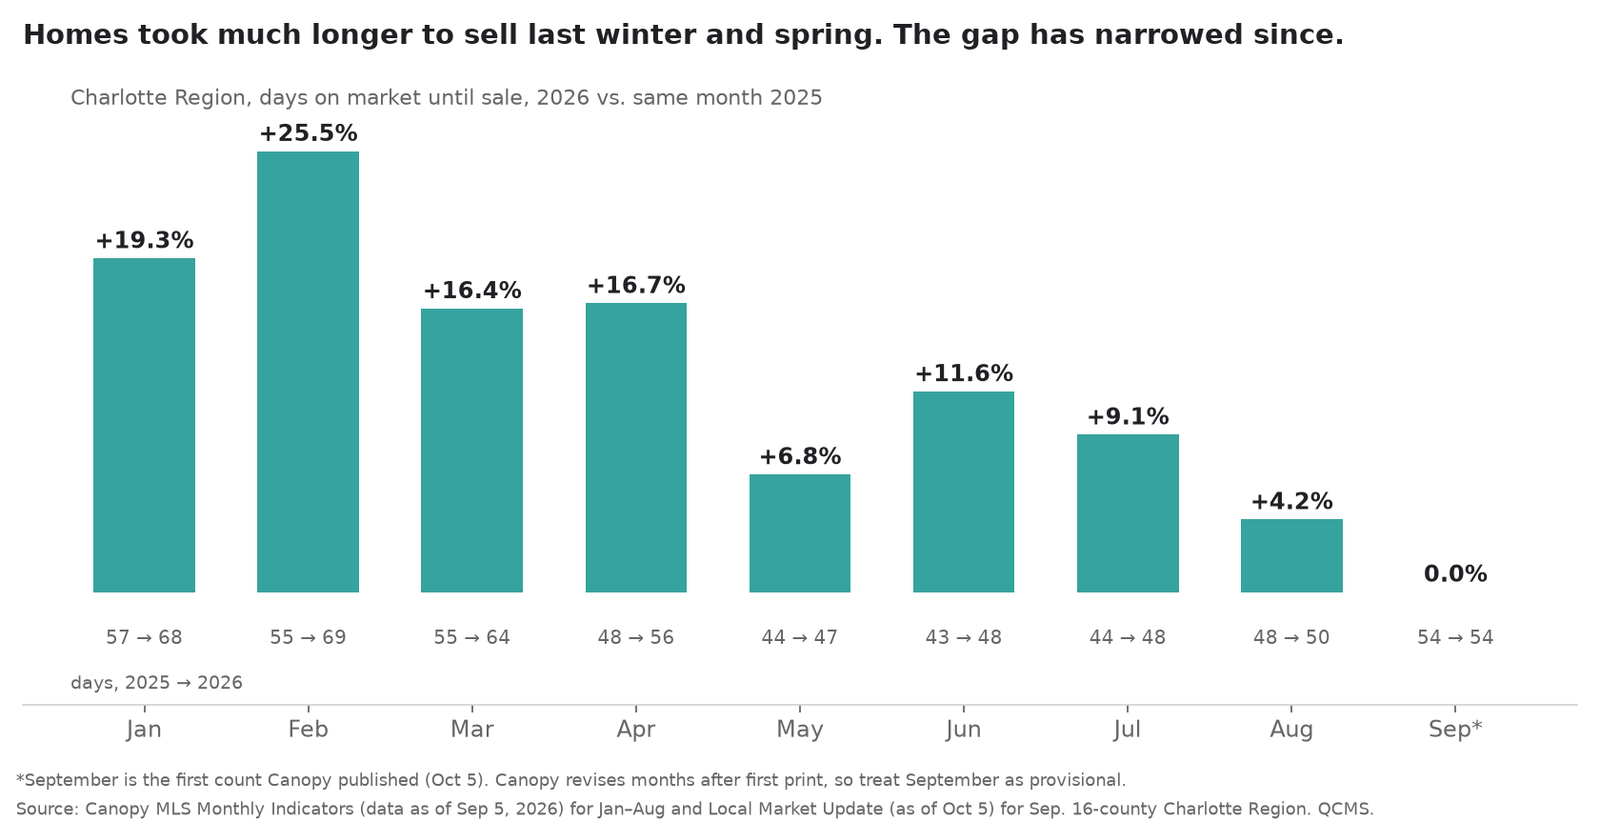
The monthly pattern matters. From January through April 2026, sellers across the Charlotte region waited 16% to 26% longer than a year earlier. The gap narrowed to 4.2% in August. Year to date through September, region days on market were 55, up from 49, and list-to-close time was 100 days, up from 94.
Price moved less than time. Across the region, Canopy data shows sellers received about 94% to 96% of their original list price in every month of 2026, and 96.3% in Mecklenburg in the third quarter. For many sellers, the added cost has been the wait, not one large price cut.
To Sell versus Rent – things to consider when making that decision
Here is how to weigh the three options, starting with what waiting costs.
How much is another month on the market costing me?
Days on market sounds abstract until a mortgage payment comes out of your bank account. Waiting for a house to sell is an active expense, not a passive delay. While a listing sits, the owner keeps paying the mortgage, property taxes, insurance, utilities, HOA dues and basic maintenance, and those bills post to the bank account every month the house stays unsold. For example (a hypothetical, not a real owner), when those bills total around $3,000 a month, holding the property another six weeks costs roughly $4,500, or about $100 a day. That daily cost changes how a price reduction should be judged. Turning down a $5,000 adjustment doesn’t save $5,000 if waiting another month or two for a higher offer burns $4,500 in payments anyway. A price drop is a choice between a smaller payout today and spending nearly the same amount on bills while you wait for a contract that could take months to arrive.
Should I keep waiting at my current price?
Waiting can make sense when comparable sales support your price, the house is getting serious showings, and you can carry it without creating another problem.
Waiting carries market risk too. In the Charlotte region, inventory reached 13,558 homes in September 2026, up 5.7% from a year earlier, while pending sales were down 4.5% and new listings were down 7.8% in Canopy’s first September count. Buyers had more homes to choose from and fewer were committing. Fewer sellers were listing, too.
Ask what evidence justifies waiting on this house: more showings, or a competing listing going under contract. If nothing is expected to change, waiting at the same price means buying time at the current carry.
Should I cut the price?
A price cut works when it puts the house in front of a different set of buyers or corrects a price the market has already rejected. A small change that leaves you competing against the same better-positioned homes may only reset the conversation.
Look at the data receipts. Activity – showings, appointments, feedback. How many showings did the listing get? What objections kept repeating? Did nearby homes go under contract while yours stayed active? Was it withdrawn and relisted?
Cumulative days on market follows a property across connected listing periods, so a house that was withdrawn and relisted keeps its history. For the Charlotte region in September 2026, Canopy’s first count shows 62 cumulative days against 54 regular days. It shows how long the market has been looking.
A cut can feel like giving money away. Carrying cost does the same thing more quietly.
What if selling means taking a loss?
This is a big one, and in our experience it happens more than owners expect. Your break-even is what you owe plus what it costs to sell: the agent’s commission, closing costs and any repairs a buyer asks for. If the likely sale price falls below that, selling now locks in a loss.
The market data can’t tell you whether you are underwater. Canopy reports current prices, not what you paid or what you owe. What it does show is that prices have held. Mecklenburg County’s median sale price was $469,500 in the third quarter, up 3.2% from a year earlier, and the Charlotte region’s year-to-date median is $400,000, up 0.1%. Whether you are underwater depends on when you bought and how much you still owe.
Renting buys time and pays part of the carry while you wait. It does not change what you owe or guarantee a better price later.
Should I rent my house if it won’t sell?
Renting ends the sale problem. It leaves the cost of the house in place.
The first test is whether a realistic rent covers the mortgage, property taxes, landlord insurance, maintenance, vacancy and management. Use the rent the house is likely to earn, not the rent you need to make the spreadsheet work.
Canopy’s September rental report shows 1,338 active rentals in Mecklenburg County and an average lease price of $2,213, up 0.9% from a year earlier. The Charlotte region averaged $2,091, down 0.4%. Active rentals in Mecklenburg were down 14.4%, and leases signed across the region fell 17.0% to 738. Fewer rentals are on the market and fewer leases are being signed, and both are true. These are averages across all property types, not a rent opinion for your house.
Our study of 10,817 Mecklenburg County rental listings, including 6,423 single-family listings, found single-family homes took about 11% longer to lease in 2026, from an average monthly median of 24.4 days to 27.1. From April through August the median lease still closed at 100% of asking rent. Owners held the rent but absorbed about $200 per turnover in lost occupancy.
The sales and rental numbers don’t prove each other, but they point the same way: an owner who can’t sell and rents may be moving from one slow market into another. The difference is that an occupied rental can begin offsetting the carrying cost.
Renting also creates a job. Someone has to prepare the house, screen applicants consistently, collect rent, coordinate repairs and follow North Carolina landlord requirements. You can do it or pay a qualified manager. Either way it has a cost.
We manage rentals across the Charlotte area and are licensed in North Carolina and South Carolina, so we earn fees when owners rent. We would rather you decide on the numbers. There are Charlotte houses we would tell an owner to sell.
Halah Kablan Ladson, our broker-in-charge at Queen City Management Services (QCMS), puts it this way: “Sometimes those numbers add up, and sometimes they don’t.” Renting has to win on the owner’s actual numbers.
How did changing mortgage rates affect Charlotte sellers?
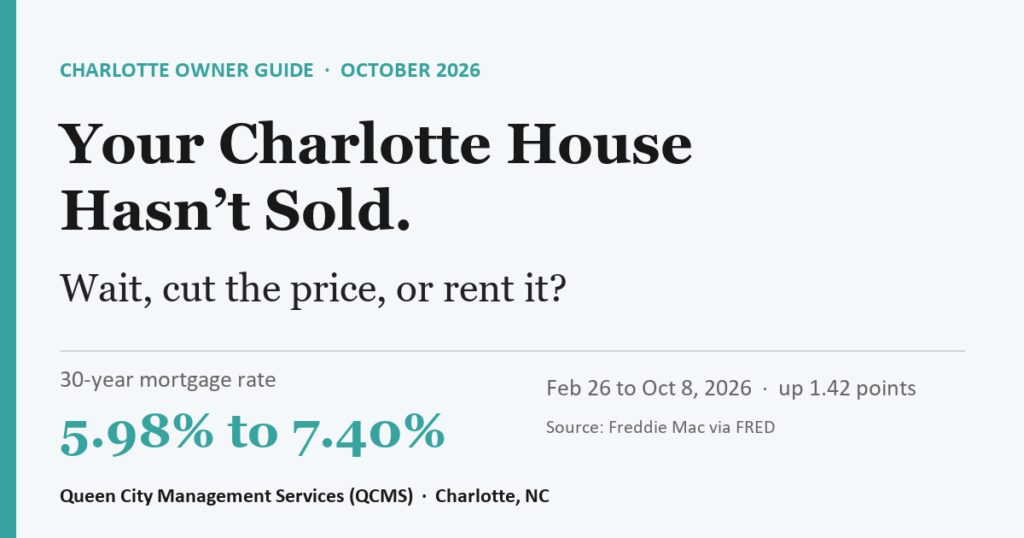
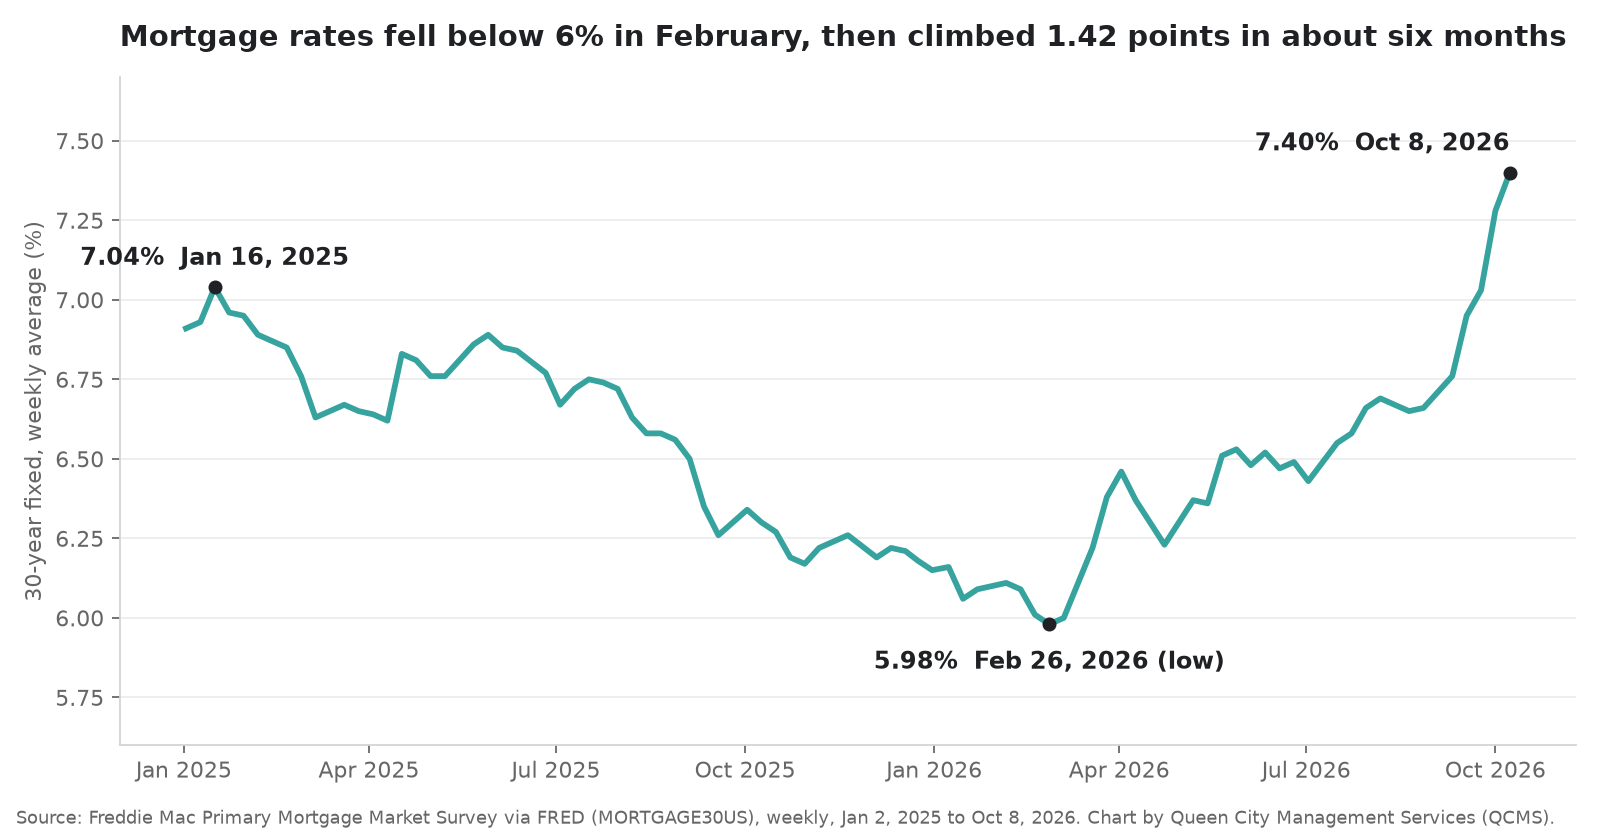
Freddie Mac’s weekly national average for a 30-year fixed mortgage hit 5.98% on February 26, 2026, the lowest week since the start of 2025, then rose to 7.40% by October 8. That is 1.42 percentage points in about six months. It is a national benchmark, not a quote for any one buyer.
Canopy’s Housing Affordability Index puts a number on it. An index of 88 means the region’s median household income is 88% of what is needed to qualify for the median-priced home at prevailing rates. It was 88 in August 2026, down from 91 in August 2025.
Rates can’t tell us what any one buyer will do, but they are a reason to test your price against today’s buying power instead of waiting for an earlier set of buyers to come back.
Election Day is November 3, 2026, and it will bring plenty of predictions about rates and housing. We wouldn’t build a Charlotte owner’s plan on any of them. This decision has to work on the numbers available now.
What numbers should I run before I decide to rent versus sell my Charlotte home?
Start with three figures. First, your estimated net sale proceeds: take a realistic sale price and subtract the mortgage payoff, the agent’s commission, closing costs, any repairs and buyer concessions. Second, your real monthly carry: mortgage, taxes, insurance, a maintenance reserve, utilities and any HOA dues. Third, your realistic rent: use recent local comparables that actually leased, not an automated online estimate.
Run each route. Waiting adds carrying cost. A price cut changes your proceeds but may shorten the wait. Renting adds vacancy, repairs and the work of operating the house once a tenant moves in.
Our Rent vs. Sell Calculator lets you put those numbers side by side, comparing a sale today with renting for three, five or ten years and then selling. Check the figures with your lender and your tax preparer first. This article is not legal, tax or financial advice.
If realistic rent covers the full cost of operating the property and you can carry a vacancy and a repair reserve, renting may buy useful time. If the house would still cost you money every month and one bad month would put you in trouble, renting is not a safe fallback. Weigh that exposure against the cost of selling now.
Sources and methods
Home-sale figures are from Canopy MLS, Inc., through the Canopy Realtor® Association, as of Oct. 5, 2026. Canopy’s “Charlotte region” is 16 counties (12 in North Carolina, 4 in South Carolina), not Mecklenburg alone. Canopy revises each month after first publishing it, in either direction, so September 2026 and the third-quarter figures that include it are provisional. Mortgage rates are the weekly Freddie Mac 30-year fixed average, published through FRED. Rental figures are from Canopy’s September 2026 rental report and our own study, which The Charlotte Ledger covered on Sept. 30. The dollar examples are illustrations, not a real owner. This article is not legal, tax or financial advice.